Tomorrow is the deadline for general election candidates to submit their nomination papers. One newspaper suggested that Ukip might field as few as 100 candidates. Where the party does not field candidates, who will win those votes which would otherwise have been won by it?
The answer to this question could affect the outcome in scores of seats. Although Ukip won only one seat in 2015, it won over 10 per cent of the vote in almost five hundred seats. It matters where that ten per cent goes. To answer that question, I used data from the British Election Study (BES). In addition to asking a standard vote intention question, the BES also asks respondents how likely they are to ever vote for different parties on a zero to ten scale. Analysing these responses—called “propensity to vote scores” in the academic literature—can help identify voters’ second, third, or fourth most-preferred parties.
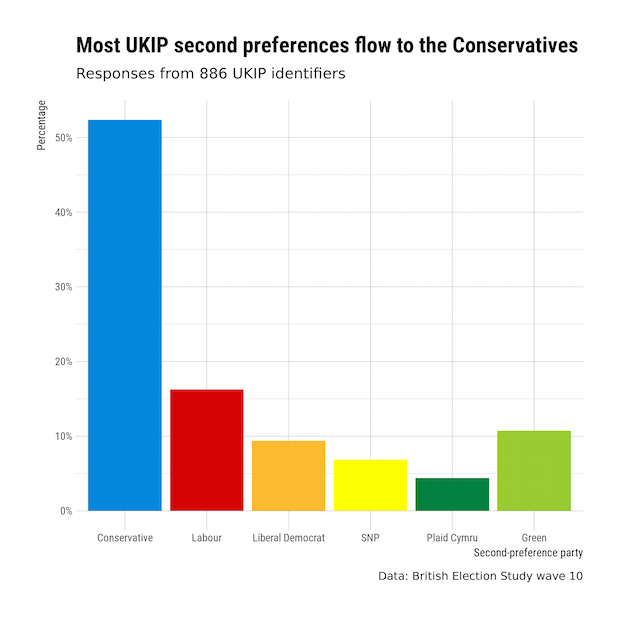
Here, I focus on respondents who gave their highest score to Ukip, and ask what proportion of these respondents gave their next highest score to each party. The results are shown in the figure below.

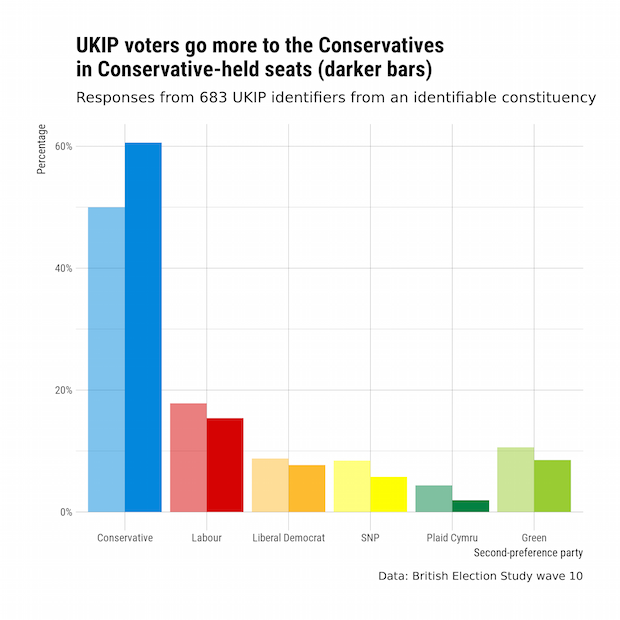
Of course, Ukip voters are of different types. Some live in seats which have been held by Labour for generations. Others live in parts of the country where Labour barely gets a look in. Might these patterns differ according to which party currently holds each seat? Figure 3 shows these second preferences separately for Conservative-held seats and all other seats.

These figures are based on data from December of 2016, at a time when Ukip was much lower in the polls than in the last election. Those voters who still identified with Ukip then may be different to those who voted for the party in May 2015. But if they are not—if more than half of the 2015 Ukip vote breaks for the Conservatives, then the consequences for the number of seats won by the Conservatives could be dramatic.
Suppose Ukip fielded candidates in their 300 best constituencies, leaving the other parties to fight over their votes in the remaining 332 constituencies. The average Ukip vote share in those seats was a little under 9 per cent. If we re-allocate those votes, giving 53 per cent to the Conservatives, 17 per cent to Labour, and 9 per cent to the Liberal Democrats (the same proportions shown in Figure 2), then even if nothing else were to change, the Conservatives would win 13 seats more than they won in 2015. That may not sound a lot given forecasts of triple-digit Conservative majorities—but it’s another indication of how the electoral system, which for so long worked against the Conservatives, is now giving them the fairest of fair winds.


