Towering insecurity
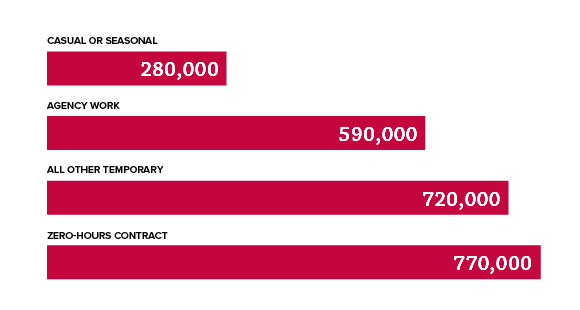
All told, there are something like 2.4 million workers who might be called “contractually exposed,” that is employed on terms which do not give the security of a regular job. (This is over-and-above the 4.9 million of self-employed, some substantial but uncertain proportion of whom are unwilling freelancers with next to no employment rights at all). Calculated from final-quarter 2019 data—to show the latest non-pandemic snapshot—the chart shows the breakdown between different forms of insecurity.

Uncertainty on an industrial scale
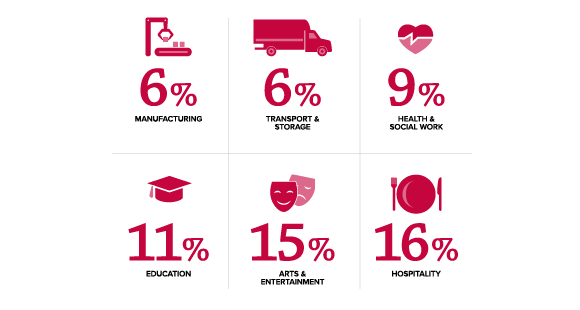
Britain’s unreliable jobs are not spread equally across the economy. Work in some sectors and you are overwhelmingly likely to be securely employed—if you’re in insurance or banking, for example, the chance of being “contractually exposed” is as low as 3 per cent. But the proportions are twice as high across great swathes of the economy, and more than five times as high in some giant industries such as hospitality. And interestingly, insecurity is pretty widespread too in some important and less-expected fields, such as education.

Poor and precarious
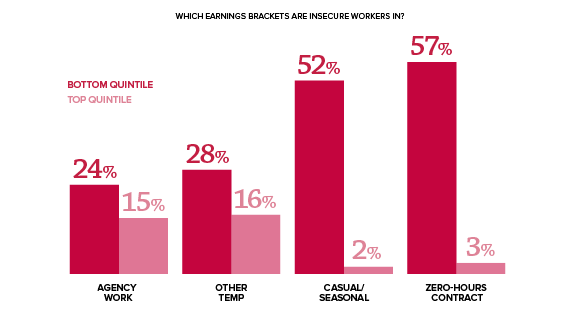
At least as important as the differences between different industries are the differences within them. In healthcare, for example, the sort of precarity this report highlights for hands-on care workers is much less likely to be an issue for medical consultants and senior managers. Indeed, it tends to be concentrated among the very people least able to budget easily around it—those on low pay. The chart shows how many contractually exposed workers are found among the top and bottom fifth of earners, and reveals that all forms of insecure work are more prevalent at the bottom end, and that in the case of some forms of insecure work—such as zero-hours contracts—the differences are overwhelming.

Young and secure
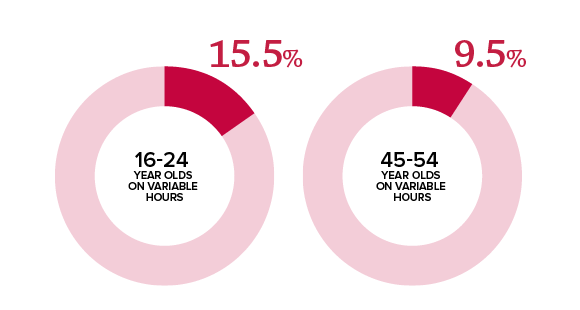
The exposure of younger workers is a marked feature of the modern British labour market: youth unemployment rose far more than general unemployment in the great recession, and more recently pandemic lockdowns bit particularly hard on sectors such as hospitality with younger staff. Their contractual arrangements are also frequently less dependable—the chart shows that youthful workers (aged 16-24) are more than half as likely again as those of prime age (45-54) to work variable hours.

Sources: Chart 1: JRF analysis of Labour Force Survey (2019, Q4). Note: The four categories of insecure forms of work are mutually exclusive. We define zero-hours contract as all workers declaring this contract, independent of them being self-employed or a permanent or temporary employee. Definitions of agency workers, casual, seasonal, other temporary and self-employed exclude those on a zero-hours contract. Chart 2: JRF analysis of Labour Force Survey (2019, Q4). Chart 3: JRF analysis of Labour Force Survey (2019, Q4). Chart 4: JRF analysis of ONS Annual Population Survey, 2019. Note: We classify employees as reporting variable hours if their working hours in the survey period differ from their stated usual hours of work by more (or less) than 20%. We also include employees who do not satisfy these criteria but state that they have no usual pay because their hours of work or overtime vary.


